Le-Berre, Francois
2010-10-06 12:33:54 UTC
Hello,
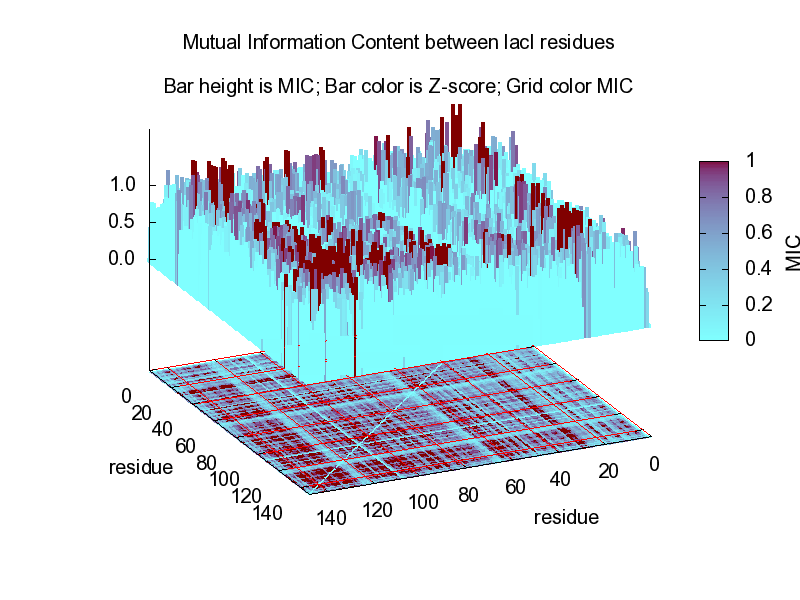
I would like to know if it possible to plot a 3D histogram (GNUPLOT version 4.2, under windows).
My need is the following : i want to plot in Z a signal level per CCD pixel, in X the X_pixel index, in Y the y_pixel index of the CCD sensor.
Best regards
François Le Berre
Ce courriel (incluant ses éventuelles piÚces jointes) peut contenir des informations confidentielles et/ou protégées ou dont la diffusion est restreinte. Si vous avez reçu ce courriel par erreur, vous ne devez ni le copier, ni lâutiliser, ni en divulguer le contenu à quiconque. Merci dâen avertir immédiatement lâexpéditeur et d'effacer ce courriel de votre systÚme. Astrium décline toute responsabilité en cas de corruption par virus, dâaltération ou de falsification de ce courriel lors de sa transmission par voie électronique.
This email (including any attachments) may contain confidential and/or privileged information or information otherwise protected from disclosure. If you are not the intended recipient, please notify the sender immediately, do not copy this message or any attachments and do not use it for any purpose or disclose its content to any person, but delete this message and any attachments from your system. Astrium disclaims any and all liability if this email transmission was virus corrupted, altered or falsified.
---------------------------------------------------------
Astrium SAS (393 341 516 RCS Paris) â Capital: 16.587.728 EUR â SiÚge social: 6 rue Laurent Pichat, 75016 Paris, France